- Background and Aims: DNA barcoding is a fast and reliable tool to assess and monitor biodiversity and, via community phylogenetics, to investigate ecological and evolutionary processes that may be responsible for the community structure of forests.
- Methods: In this study, DNA barcodes for the two widely used plastid coding regions rbcL and matK are used to contribute to identification of morphologically undetermined individuals, as well as to investigate phylogenetic structure of tree communities in 70 subplots (10 × 10m) of a 25-ha forest-dynamics plot in Brunei (Borneo, Southeast Asia).The combined matrix (rbcL + matK) comprised 555 haplotypes (from ≥154 genera, 68 families and 25 orders sensu APG, Angiosperm Phylogeny Group, 2016), making a substantial contribution to tree barcode sequences from Southeast Asia. Barcode sequences were used to reconstruct phylogenetic relationships using maximum likelihood, both with and without constraining the topology of taxonomic orders to match that proposed by the Angiosperm Phylogeny Group. A third phylogenetic tree was reconstructed using the program Phylomatic to investigate the influence of phylogenetic resolution on results. Detection of non-random patterns of community assembly was determined by net relatedness index (NRI) and nearest taxon index (NTI).
- Key Results: In most cases, community assembly was either random or phylogenetically clustered, which likely indicates the importance to community structure of habitat filtering based on phylogenetically correlated traits in determining community structure. Different phylogenetic trees gave similar overall results, but the Phylomatic tree produced greater variation across plots for NRI and NTI values, presumably due to noise introduced by using an unresolved phylogenetic tree.
- Conclusions: Our results suggest that using a DNA barcode tree has benefits over the traditionally used Phylomatic approach by increasing precision and accuracy and allowing the incorporation of taxonomically unidentified individuals into analyses.
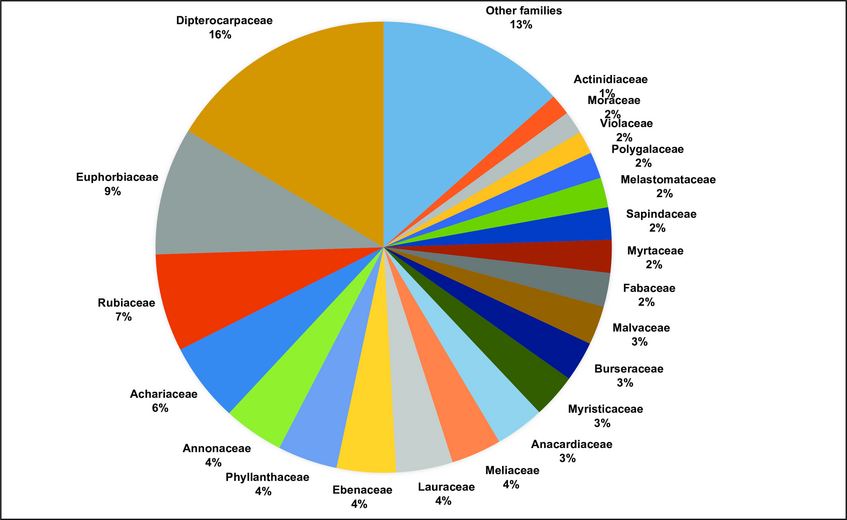
Abundance of frequent plant families in the 70 subplots of the 25 ha forest dynamics plot in Kuala Belalong
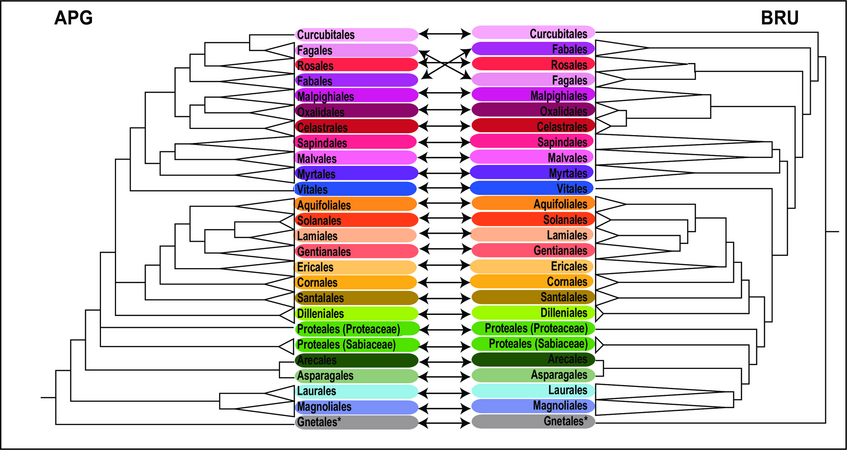
Comparison of ordinal-level topologies of the trimmed APG tree obtained by Phylomatic (APG) and the barcode tree (rbcL + matK; BRU) obtained from maximum likelihood analysis.
Orders are connected by arrows. *: The order Gnetales represents the gymnosperms, whereas all other orders are angiosperms.